Dashboard
AsyncMQ ships a built-in operations dashboard ASGI app in asyncmq.contrib.dashboard.
Wrapper class: AsyncMQAdmin
This dashboard is designed for day-to-day queue operations and incident response:
- queue, job, and worker visibility
- retry/remove/cancel controls
- DLQ and repeatable management
- action audit trail
- live + historical metrics views
Related pages:
- Dashboard Capabilities
- Dashboard Operations Playbook
- Dashboard API and Route Reference
- Authentication Backends
Architecture
flowchart LR
    A["Host ASGI App\n(FastAPI/Lilya/Starlette)"] --> B["AsyncMQAdmin"]
    B --> C["Optional AuthGateMiddleware"]
    B --> D["Session Middleware"]
    B --> E["Dashboard Lilya App"]
    E --> F["Controllers"]
    F --> G["Configured AsyncMQ Backend"]
    E --> H["SSE Endpoint (/events)"]
    E --> I["Metrics History (/metrics/history)"]
    E --> J["Audit Trail (/audit)"]
Visual Page Map
flowchart TD
    O["Overview /"] --> Q["Queues /queues"]
    Q --> QD["Queue Detail /queues/{name}"]
    QD --> J["Jobs /queues/{name}/jobs"]
    QD --> D["DLQ /queues/{name}/dlq"]
    QD --> R["Repeatables /queues/{name}/repeatables"]
    O --> M["Metrics /metrics"]
    O --> W["Workers /workers"]
    O --> A["Audit /audit"]
What the Dashboard Covers
| Area | Route | Primary Actions |
|---|---|---|
| Overview | / |
queue/job/worker totals, live charts, latest jobs/queues |
| Queues | /queues |
inspect queue state, pause/resume |
| Queue Details | /queues/{name} |
queue-level status and controls |
| Jobs | /queues/{name}/jobs |
state tabs, text search, task/id filters, retry/remove/cancel |
| DLQ | /queues/{name}/dlq |
retry/remove failed jobs |
| Repeatables | /queues/{name}/repeatables |
pause/resume/remove repeatable definitions |
| Workers | /workers |
active worker visibility |
| Metrics | /metrics |
throughput/retry/failure cards, history charts/tables |
| Metrics History API | /metrics/history |
JSON snapshots for historical chart/table rendering |
| Audit Trail | /audit |
searchable log of queue/job/dlq/repeatable actions |
| SSE Stream | /events |
near-real-time updates to UI cards/charts/tables |
UI Screenshots
Replace each placeholder URL with your real screenshot URL or local static path.
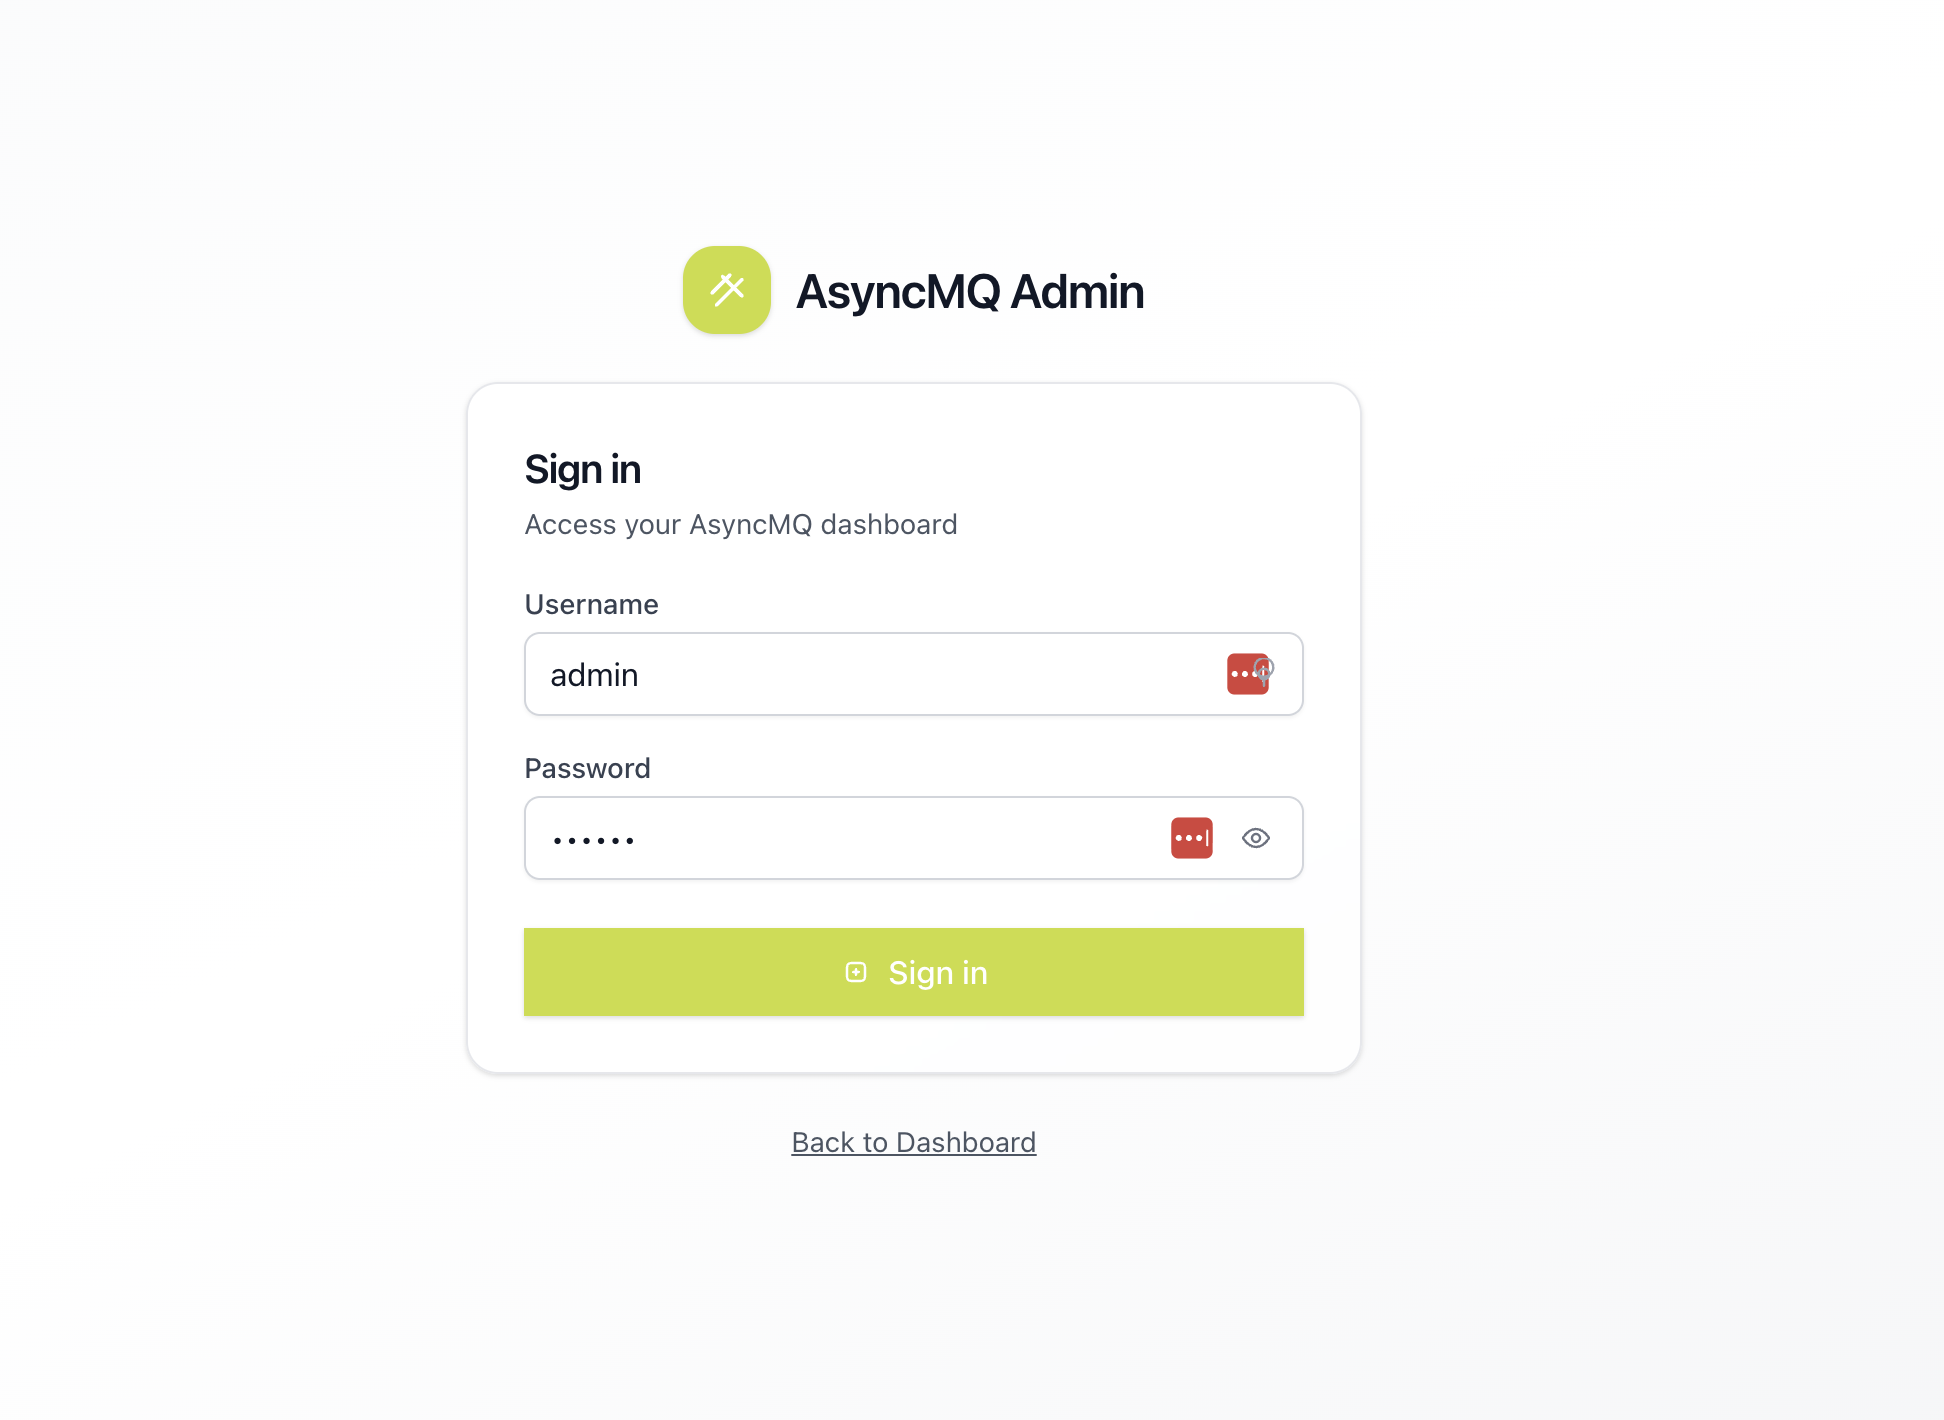
Login
The login page is the first operator touchpoint when authentication is enabled. It should clearly show the environment context and expected credentials flow.
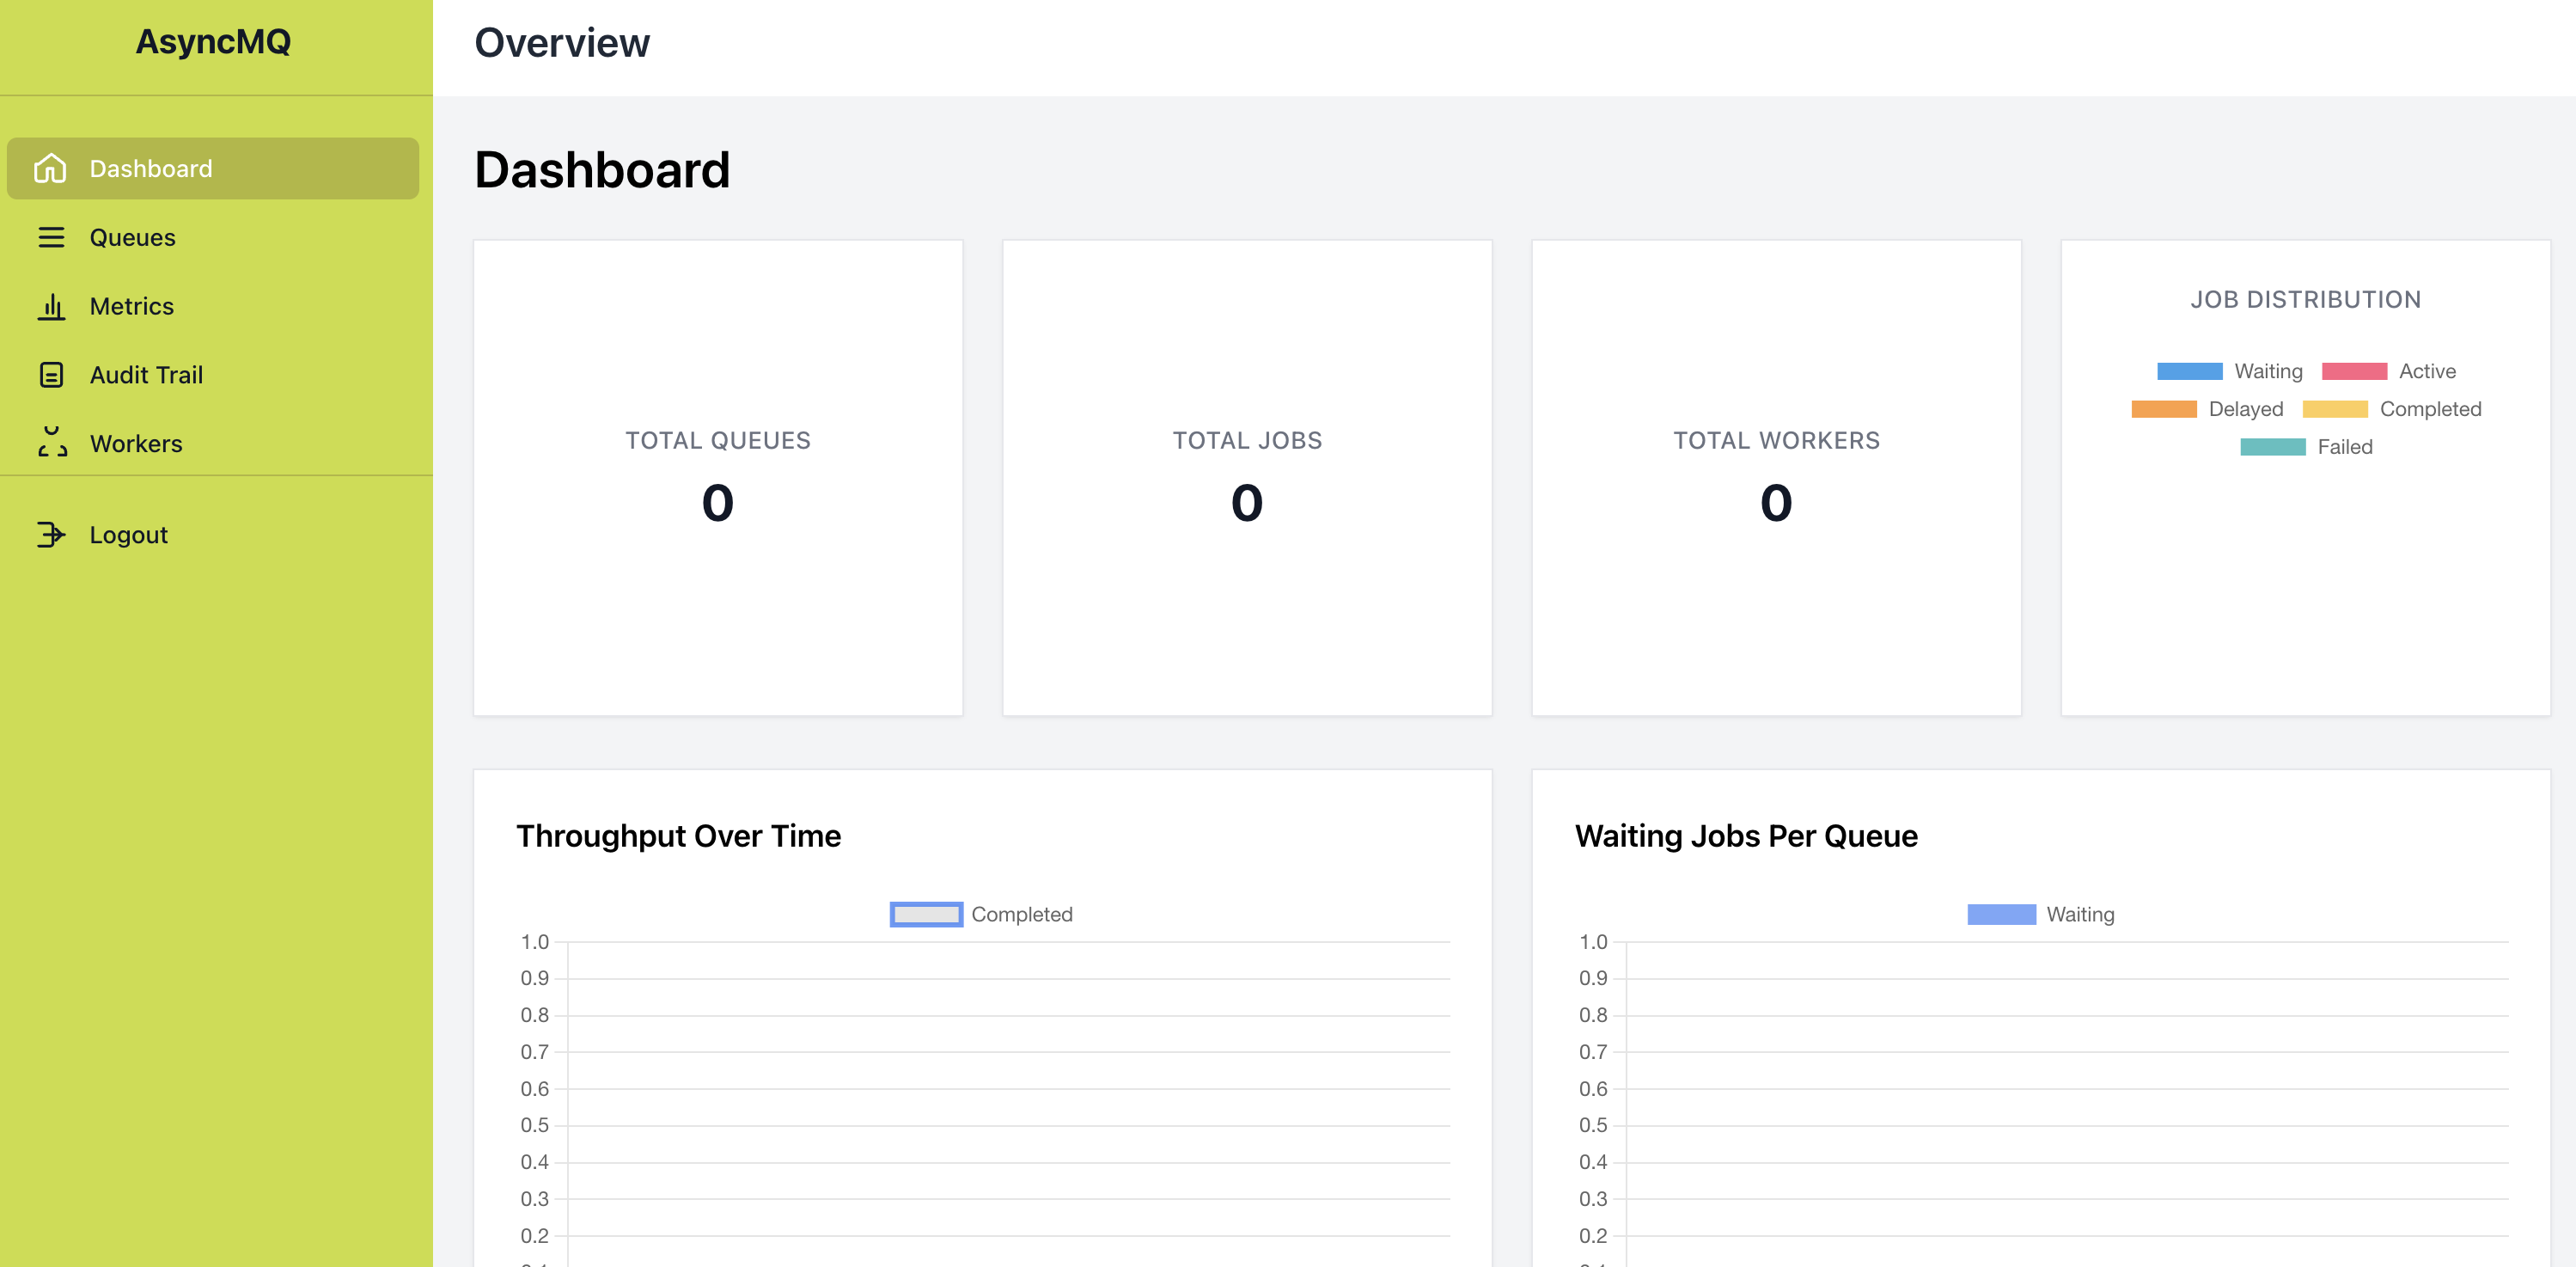
Dashboard Overview
The overview page gives a fast health snapshot: total queues, total jobs, total workers, and live charts/tables for recent activity.
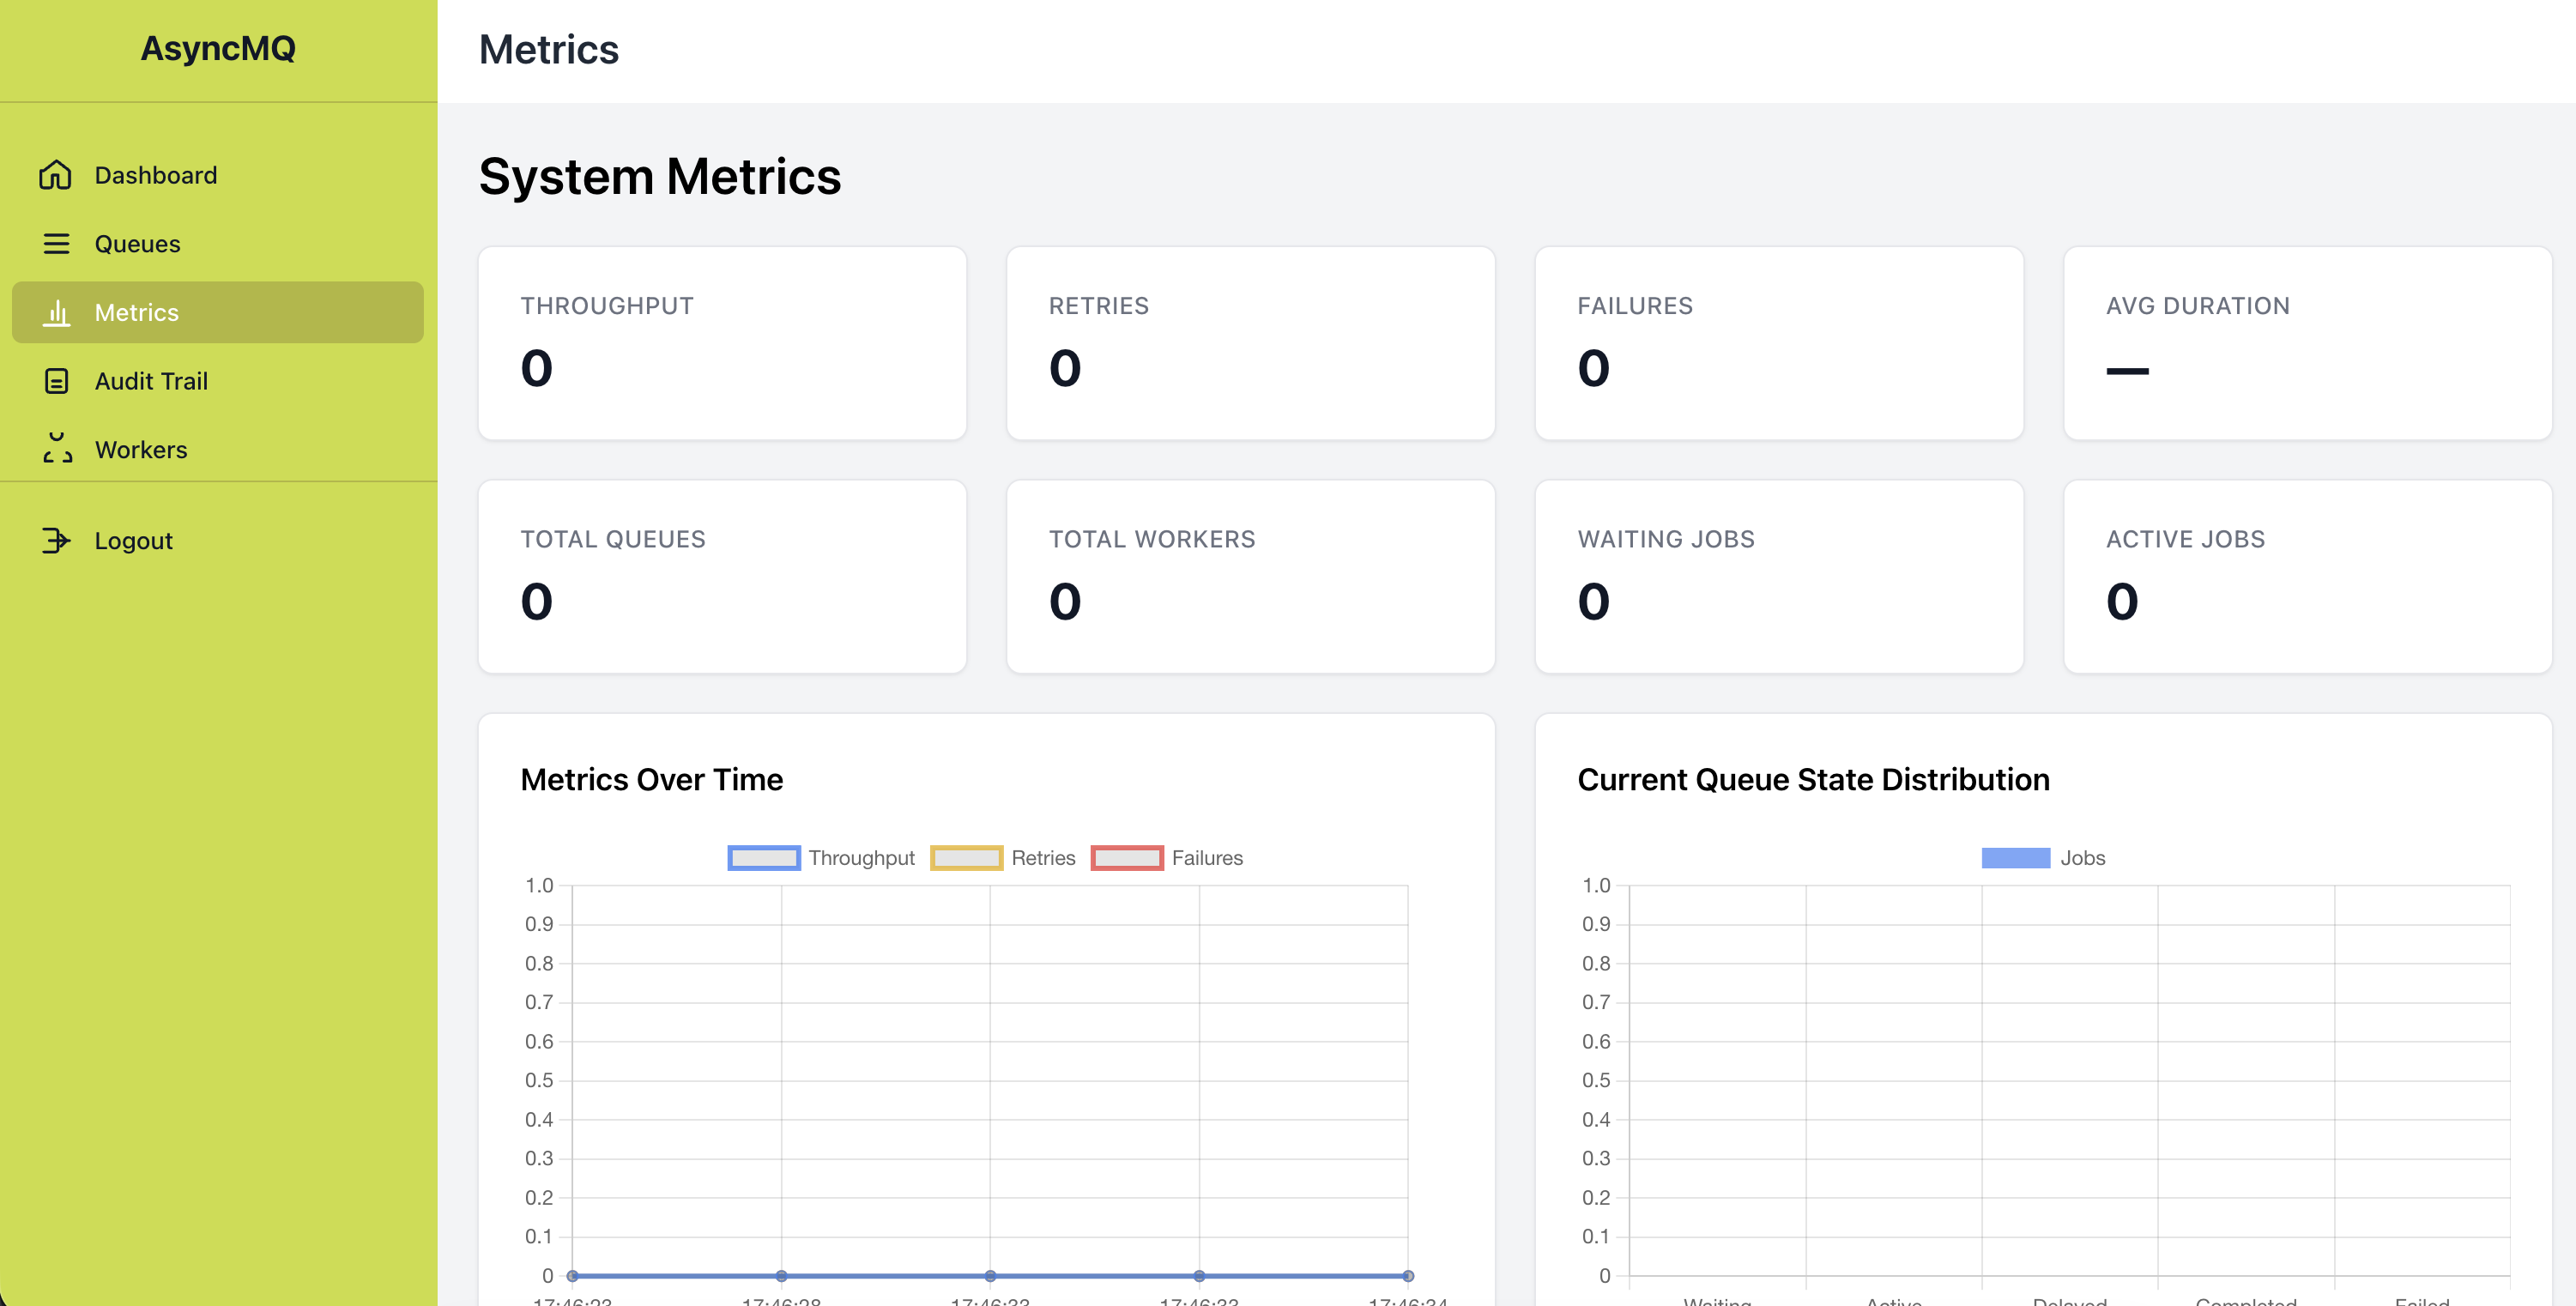
System Metrics
The metrics page combines live SSE updates with recent history snapshots, helping operators correlate throughput, retries, failures, and queue-state distribution.
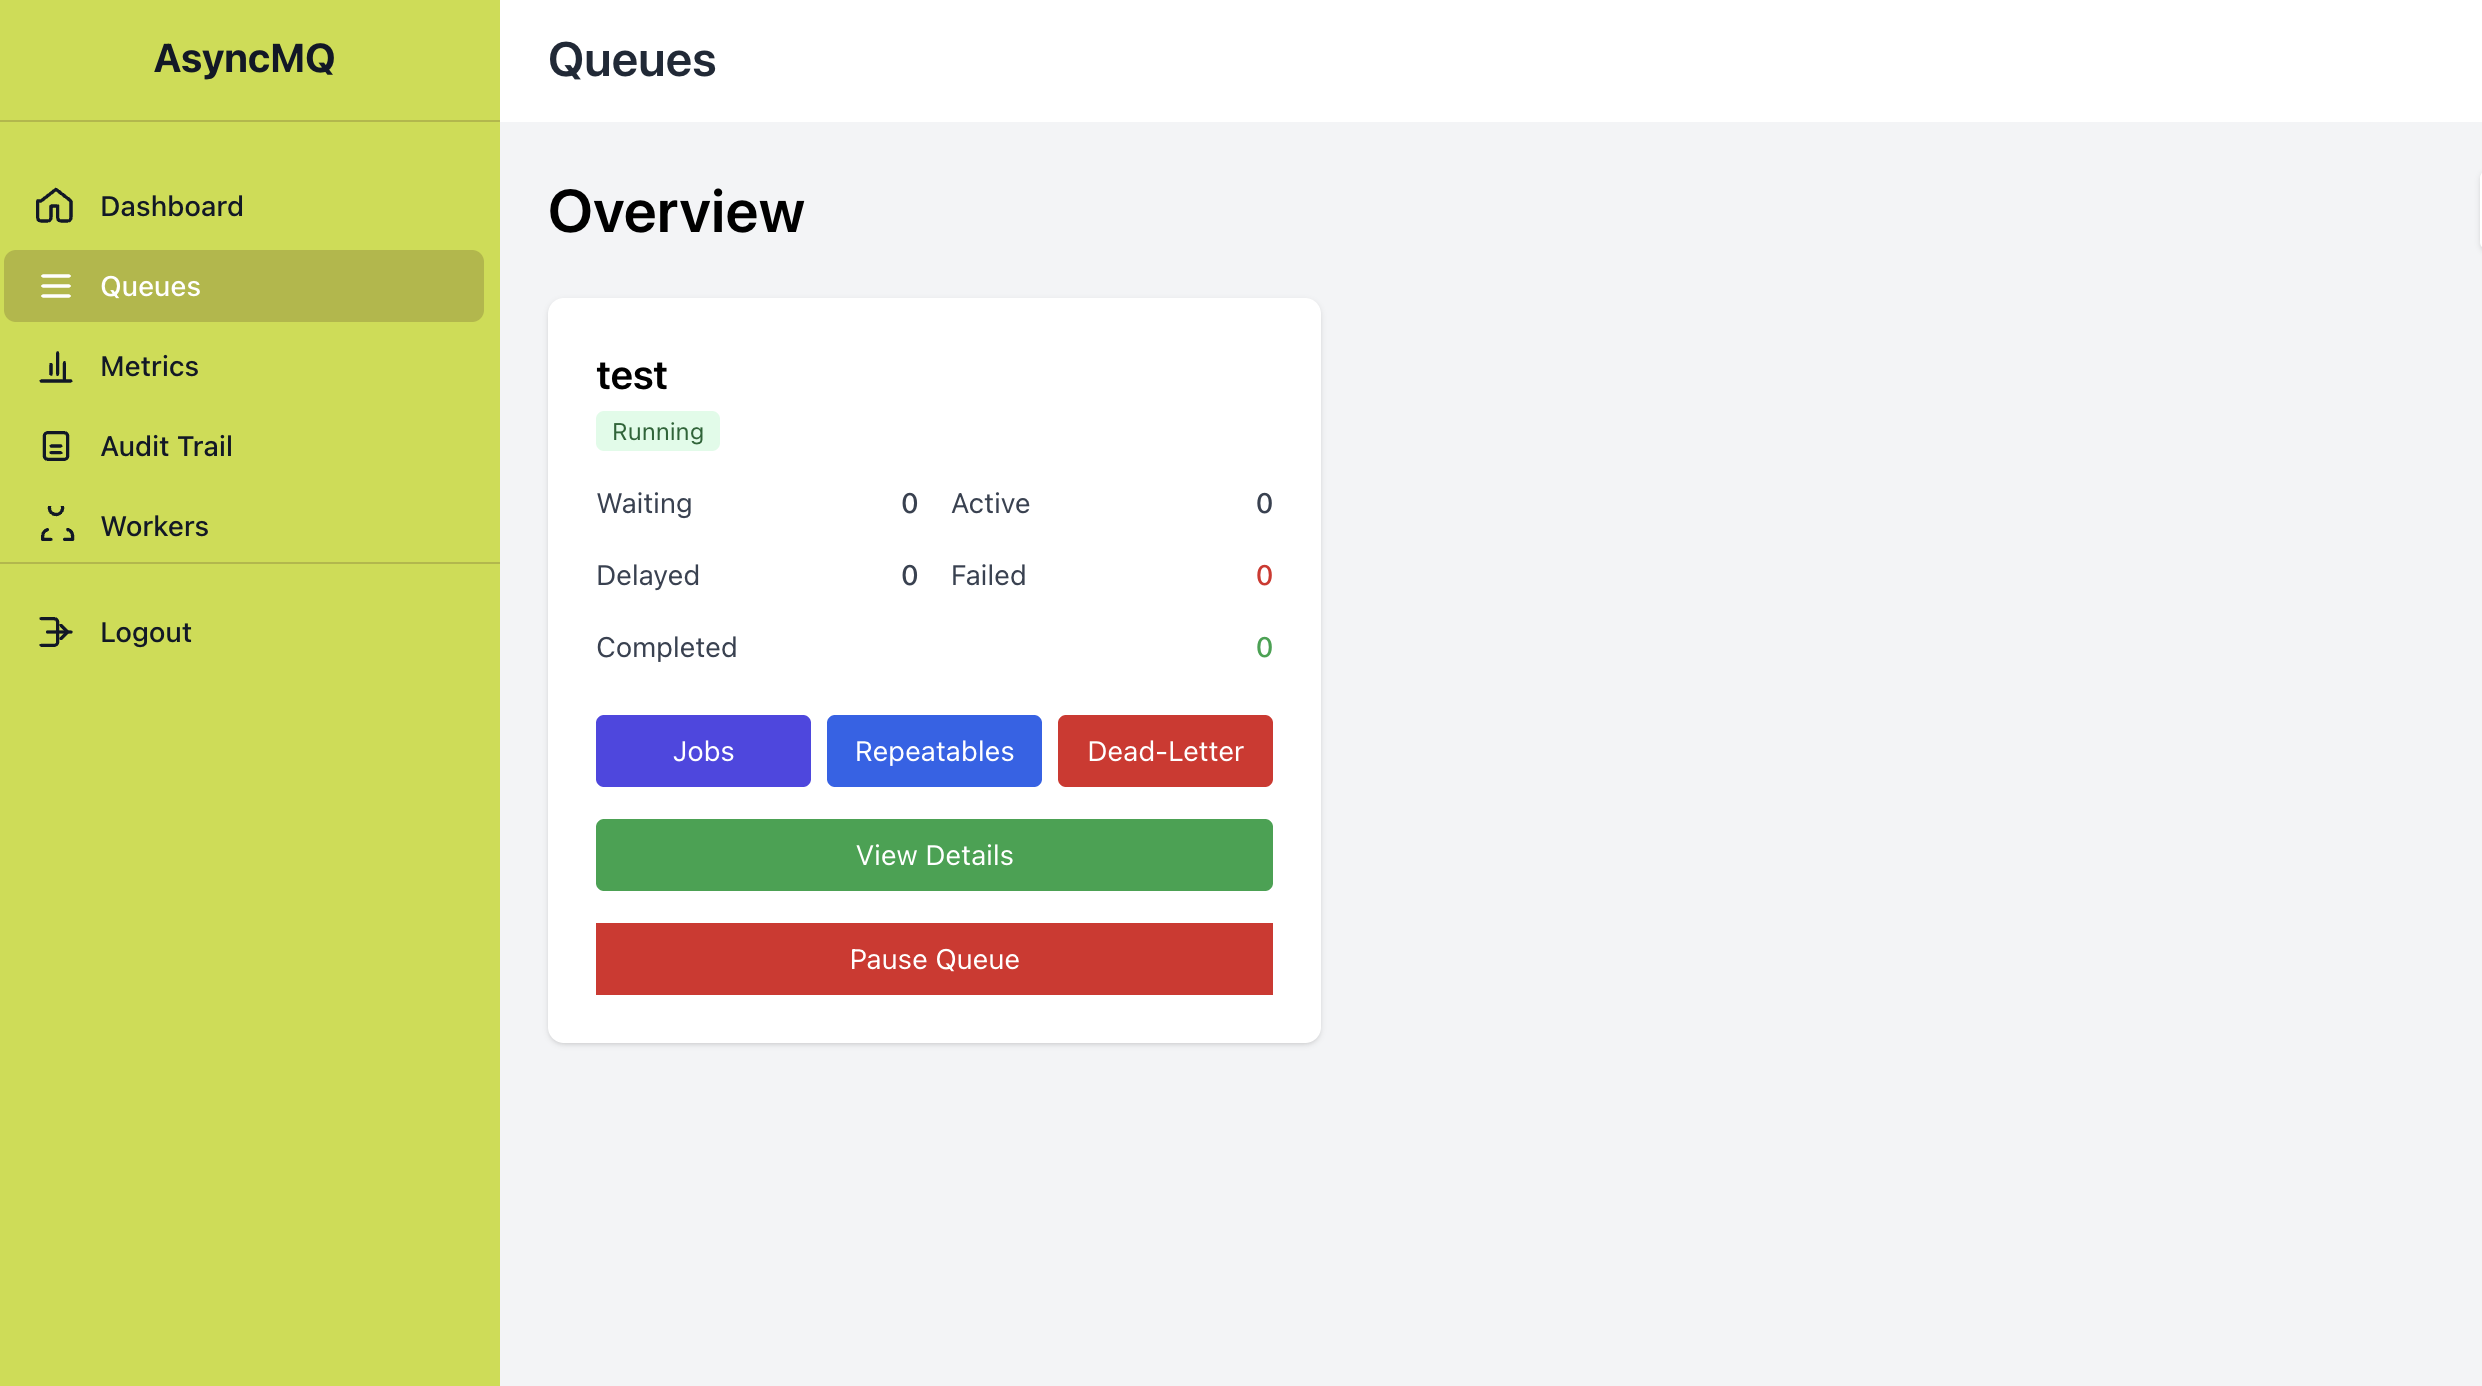
Queues
The queues page is the control center for queue-level triage, including backlog visibility and pause/resume operations.
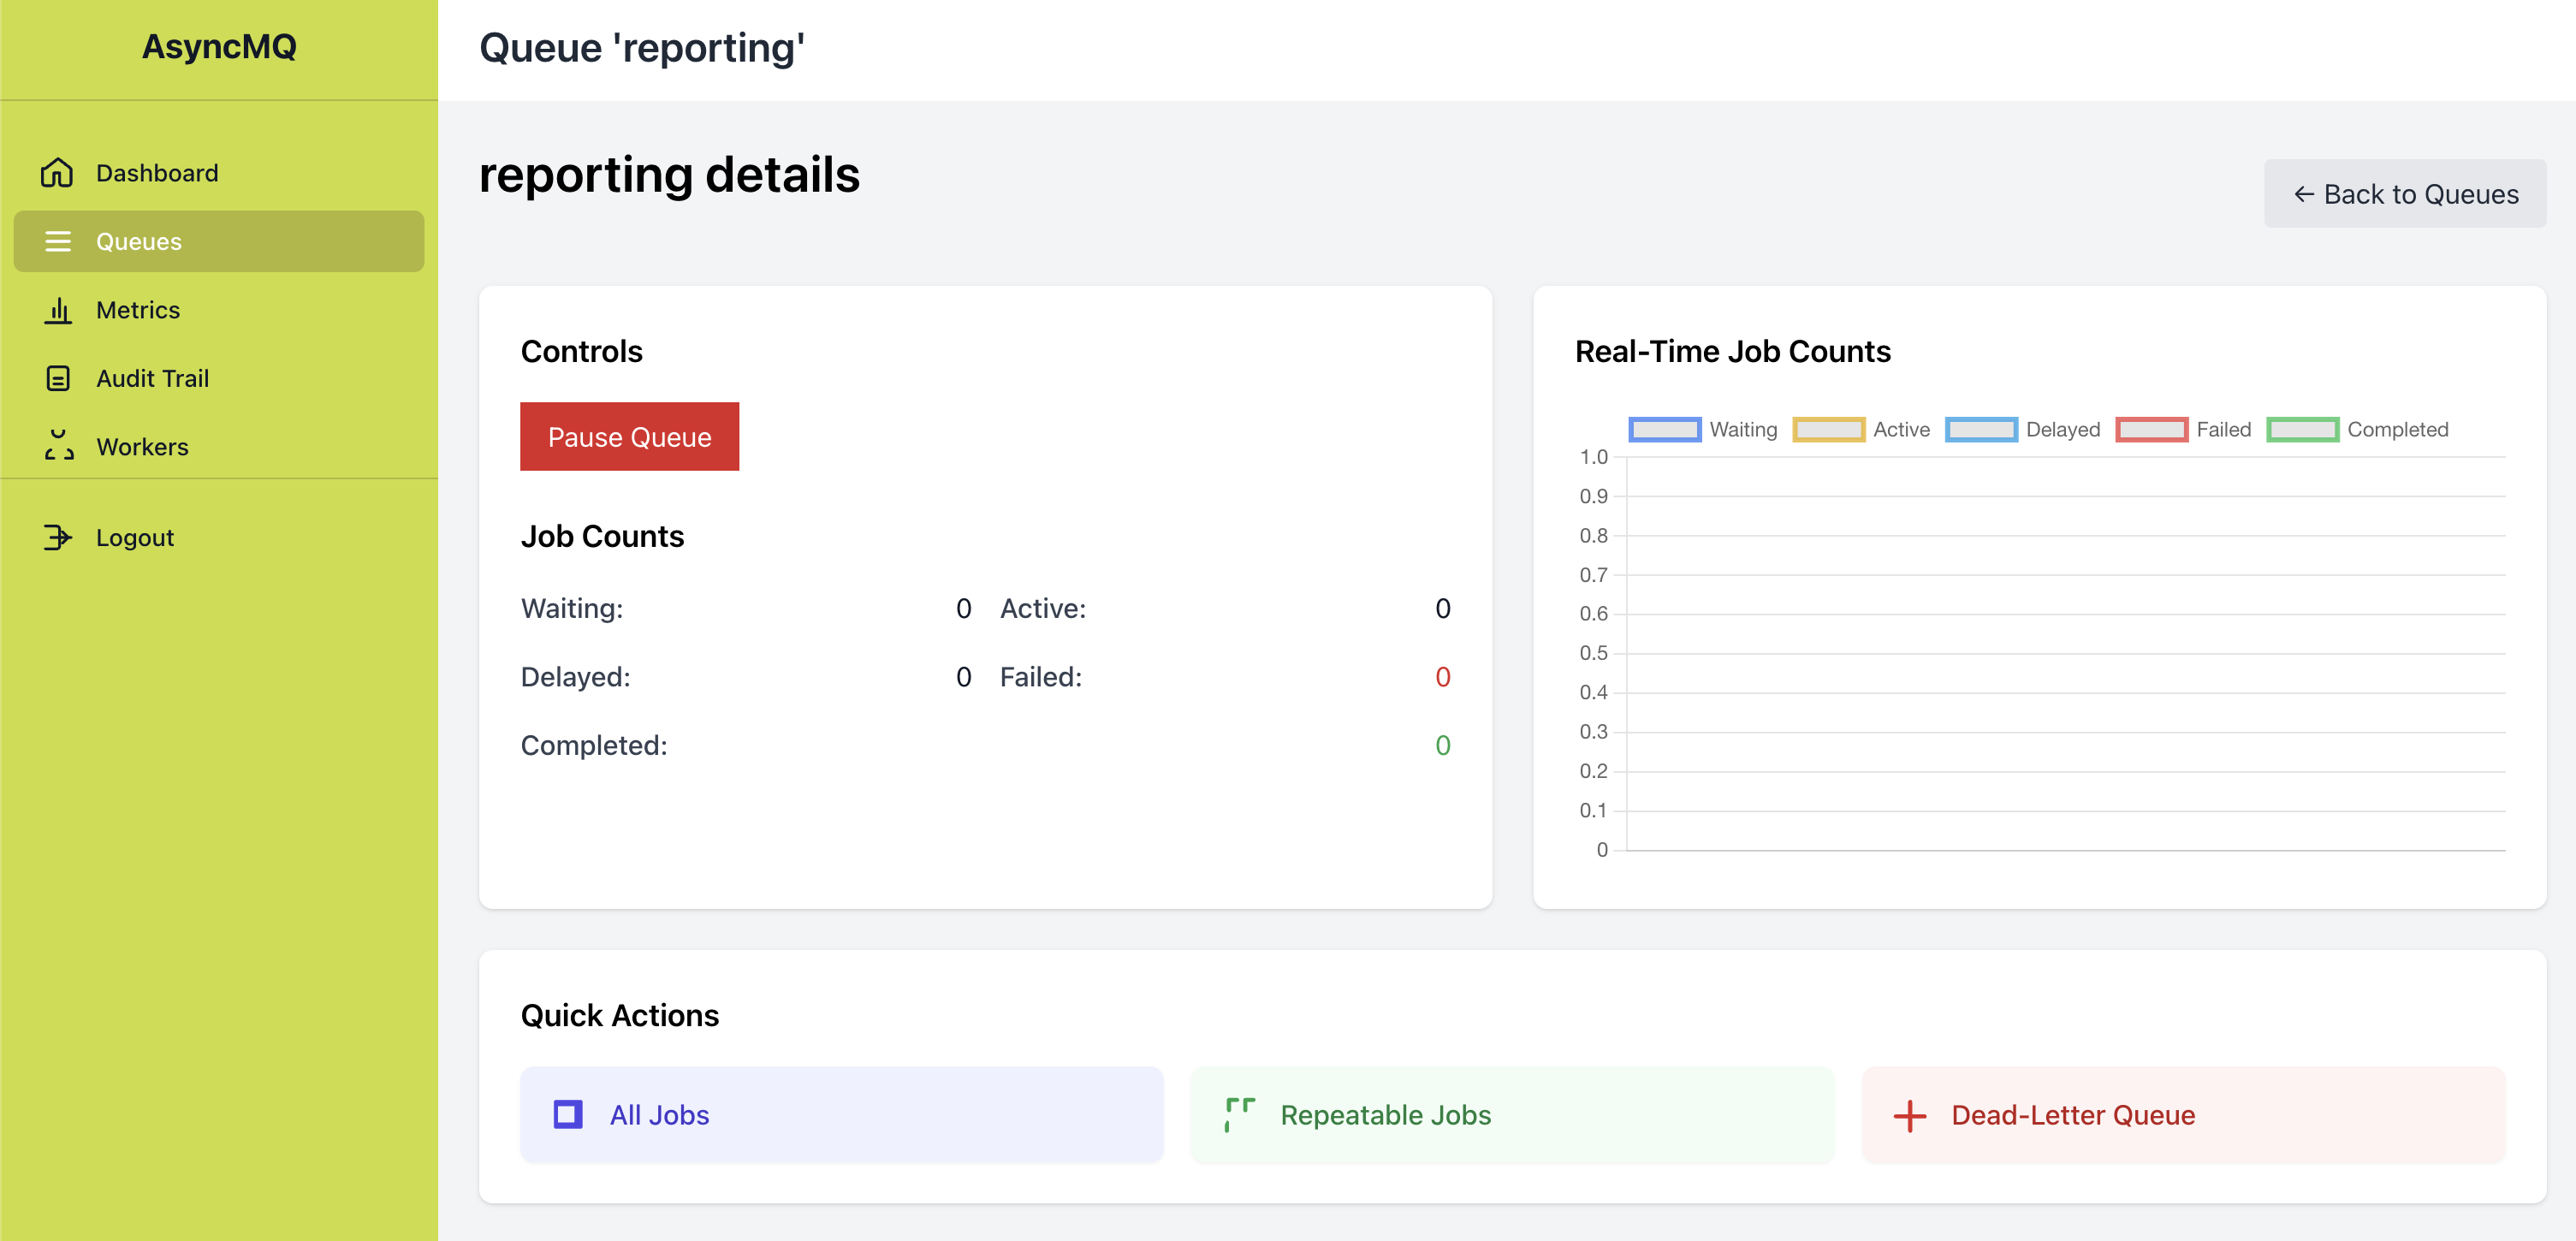
Queue Details
Queue details provide a focused per-queue breakdown and direct links into jobs, DLQ, and repeatables workflows.
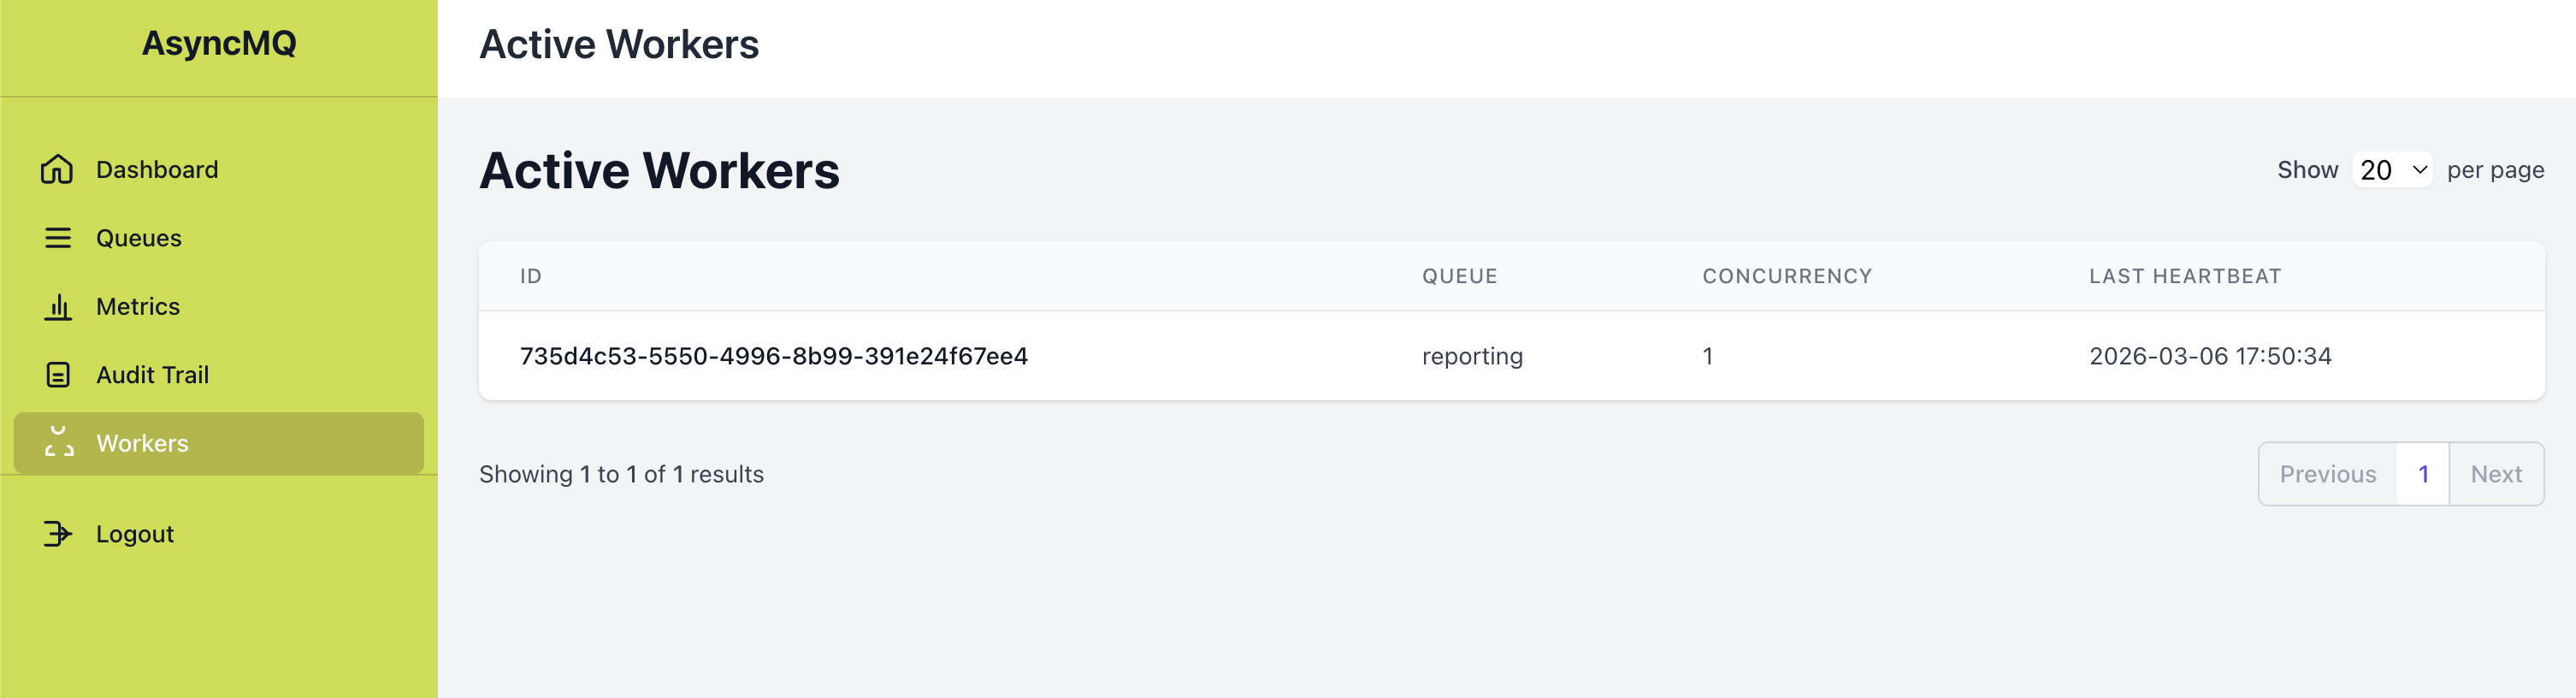
Workers
The workers page highlights active worker identities, queue assignment, concurrency, and heartbeat recency for operational confidence.
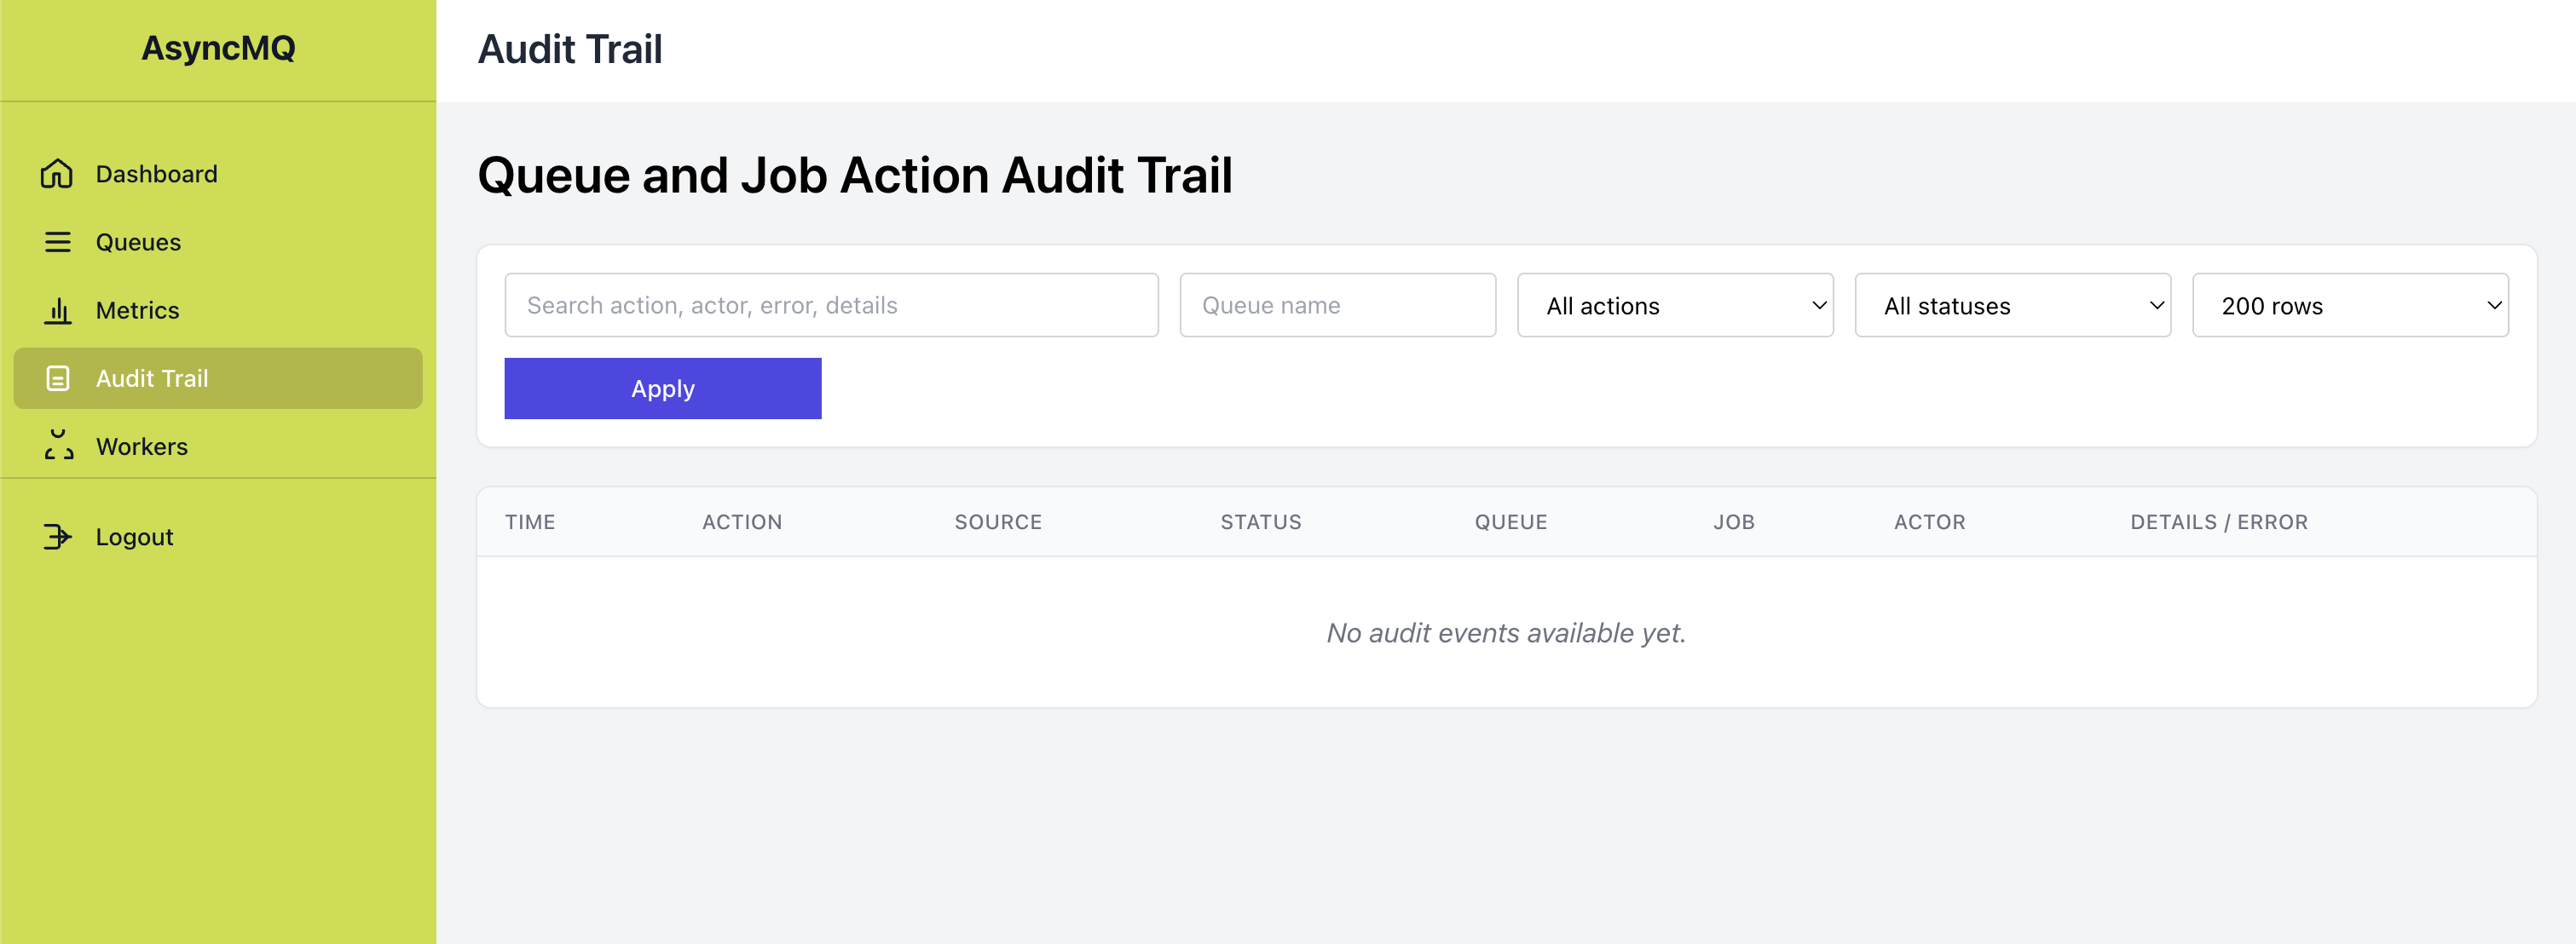
Audit Trail
The audit page records queue/job/dlq/repeatable actions and supports filtering/search, which is useful for incident reviews and change traceability.
Quick Start
Lilya
from lilya.apps import Lilya
from asyncmq.contrib.dashboard.admin import AsyncMQAdmin

app = Lilya()
admin = AsyncMQAdmin(enable_login=False)
admin.include_in(app)
FastAPI / Starlette
from fastapi import FastAPI
from starlette.middleware.sessions import SessionMiddleware
from asyncmq.contrib.dashboard.admin import AsyncMQAdmin

app = FastAPI()
app.add_middleware(SessionMiddleware, secret_key="change-me")

admin = AsyncMQAdmin(enable_login=False)
app.mount("/", admin.get_asgi_app(with_url_prefix=True))
Configuring Look and Mount Prefix
settings.dashboard_config returns DashboardConfig.
from asyncmq.conf.global_settings import Settings
from asyncmq.core.utils.dashboard import DashboardConfig


class AppSettings(Settings):
    secret_key = "replace-in-production"

    @property
    def dashboard_config(self) -> DashboardConfig:
        return DashboardConfig(
            title="My AsyncMQ",
            header_title="Background Jobs",
            description="Queue operations",
            dashboard_url_prefix="/admin",
            sidebar_bg_colour="#CBDC38",
            secret_key=self.secret_key,
        )
High-Value Workflows
1. Find and retry a bad job quickly
- Open
/queues/{name}/jobs?state=failed. - Narrow results with
task=...,job_id=..., orq=.... - Trigger
Retryon selected jobs. - Verify action visibility in
/audit.
Example filter URL:
2. Track operator actions during an incident
- Open
/audit. - Filter by
queue,status=failed, or a specificaction. - Search free-text (
q) across action/source/error/details.
Example filter URL:
3. Investigate recent throughput and failure trend
- Open
/metrics. - Use live charts and the "Recent Metrics History" table.
- Correlate with queue backlog and worker counts.
- Pull raw snapshots from
/metrics/historyif needed for tooling.
Data Flow for Metrics
sequenceDiagram
    participant UI as Metrics UI
    participant SSE as /events
    participant API as /metrics/history
    participant BE as Backend

    UI->>API: GET /metrics/history
    API->>BE: list_queues/list_workers/list_jobs summaries
    API-->>UI: history snapshots

    UI->>SSE: open EventSource
    SSE->>BE: periodic aggregate polling
    SSE-->>UI: metrics/jobdist/overview events
Authentication
Set enable_login=True and provide an AuthBackend implementation.
Built-ins:
SimpleUsernamePasswordBackendJWTAuthBackend
Production Guidance
- Keep dashboard behind authentication and HTTPS.
- Use non-default session/JWT secrets.
- Restrict dashboard network exposure to operator/admin paths.
- Treat dashboard actions as operational controls and keep an audit review process.
- Use external observability for long-term analytics/retention.
For capability boundaries, see Dashboard Capabilities.